This article explains how to evaluate growth stocks with fundamental analysis.
First of all, growth stocks are stocks that are highly appreciated in the markets due to their expected future growth, even though at the moment they haven’t yet achieved any notable profit.
The P/E ratios of those stocks sometimes exceed 100. It seems that this kind of evaluation simply ignores the fundamentals, but the prices of the growth stocks are actually decided by evaluation based on the fundamental analysis.
Let’s take an example of Netflix (NASDAQ:NFLX). The current stock price, sales per share, earnings per share, profit margin, P/S (Price to Sales ratio) and P/E are the following:
- Stock price: $100
- Sales per share: $12.8
- Earnings per share: $0.55
- Profit margin: 4%
- P/S: 7.75
- P/E: 182
The P/E ratio is 182. This seems excessive, but this doesn’t reflect the following factors:
- The future sales growth
- The investment for the future growth, which could have been a profit
Therefore, we first estimate how much its sales will grow in 3 years. The sales of Netflix tends to increase by about 25% every year, so we roughly assume it continues for another 3 years. On this supposition, the future sales will be the following:
- Sales per share = $12.8 * 1.25 * 1.25 * 1.25 = $25
Then, what about the earnings?
The current profit margin is 4%, but this doesn’t reflected the fact that growth stocks tend to spend a large amount of money in investment. Netflix tends to spend 9% of the sales in R&D, so if we add it to the profit, the profit margin becomes about 13%. Therefore, the profit will be the following in 3 years:
- Earnings per share = $25 * 0.13 = $3.25
Consequently, assuming the stock price doesn’t change from $100, its P/E is the following:
- P/E = $100 / $3.25 = 30.76
This is still high but looks more reasonable. With the same calculation again, we get its P/E 6 years later, which is 15.74. This is finally below the average of S&P 500.
This means that Netflix trades at such a level that the investors assume it continues to grow by 25% per year for another 6 years.
Is this reasonable? The sector of the internet television itself might continue to grow at that speed, although we might doubt if it is safe to invest in a specific company with that supposition. Will Netflix never fail in its financial or advertisement strategies and keep its growth for 6 years? This is what investors need to review.
Sales per share isn’t a common figure in most of the financial websites, so there is a generalized formula that uses the P/S ratio to calculate the P/E ratio n years later. g is annual sales growth, and m is profit margin.
- P/E = { P/S / (1+g)^n } / m
The following is the chart of the 3-year-later P/E ratios of Amazon (NASDAQ:AMZN), Google (NASDAQ:GOOG), Alibaba (NYSE:BABA), Twitter (NYSE:TWTR) and Facebook (NASDAQ:FB) using the formula.
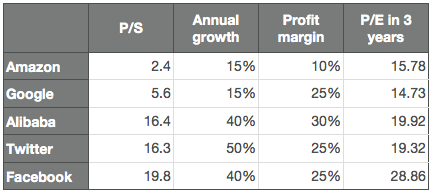
We see that Netflix and Facebook are appreciated, presumably since their future growths are more secured than the others.
Here is the calculator of the future P/E. The percentage of the annual sale growth and the profit margin needs to be roughly estimated, considering the past earnings releases and the future potentials.
Calculator