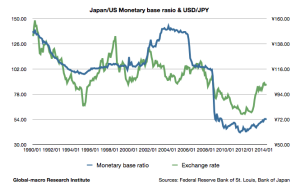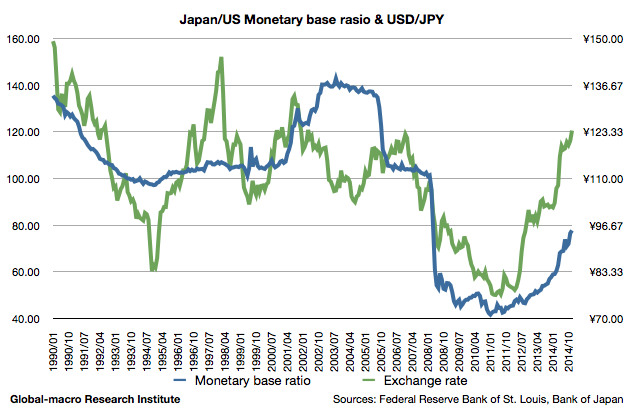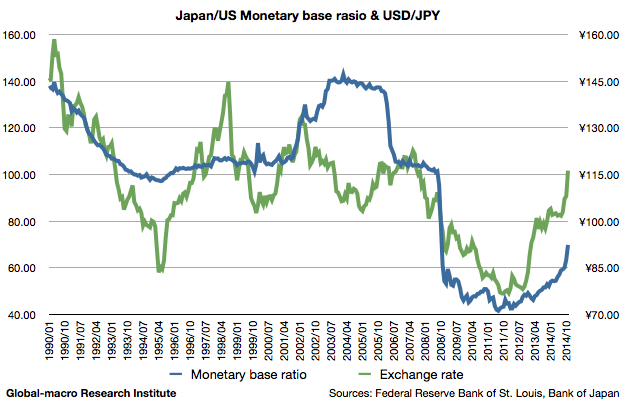
This is the graph of USD/JPY and the ratio of the two countries’ monetary bases since 1990. For a decade since 1995, the amount of the issued yen per a dollar had been around 100 with the exchange rate being around ¥115, but then the Fed moved to financial easing according to the crisis in 2008. As a result, the ratio went down to around 50, which has still been the range until now as both of the central banks have been engaged in quantitative easing.
It is assumed that the monetary base ratio will resume to be 70-75 when the Fed totally stops the easing and the Bank of Japan finishes the QE of 2 years. The last time we observed that range of the ratio was from Oct to Nov in 2008, when the exchange rate was around ¥98.
To estimate the current due exchange rate from this, we need to consider that the foreign exchange market usually precedes the monetary base, and that in late 2008, the market was in a hurry to reflect the quantitative easing that would be held afterwards. We also need to note that according to the data by the IMF, the real economic growth of the US between 2008 and 2014 is estimated to be 9.2% whereas that of Japan is assumed to be merely 2.8%. Considering these, the current range of the exchange rate, ¥100-105 can be said to be quite appropriate, and due to the Japan’s trade deficit, which hasn’t decreased even with the weak yen, would lead the rate to be ¥105-110 in a middle or long-term.
In a short term, investors should be careful of the enormous short positions on the yen, which have been piled since late 2012, although the situation wouldn’t help the speculators demoralise the market, as few factors are seen to change the investors’ long-term view, and the additional QE is still possible if the inflation rate doesn’t increase. The investors would need to move in the Japanese stock market considering this moderate future of the currency market. After a fuss, with the speculators discouraged, the cheap and expensive stocks will just come to the due price, without causing any dominant trend in the Nikkei index.


