On the third of November, 2015, the ECB (European Central Bank) decided to cut interest rates and to extend its quantitative easing. Whilst we interpreted the market’s reaction in the following article, in this article we analyze how the increasing monetary base affects EUR/USD in a long term.
In this meeting, the deposit rate was lowered from -0.20% to -0.30%, and the QE programme was extended from September 2016 to March 2017. Thus, we first look into how the monetary base changes by the end of March 2017.
The monetary base
We compare the euro to the dollar. The following is the chart of the monetary base ratio of the US to the euro zone and EUR/USD:
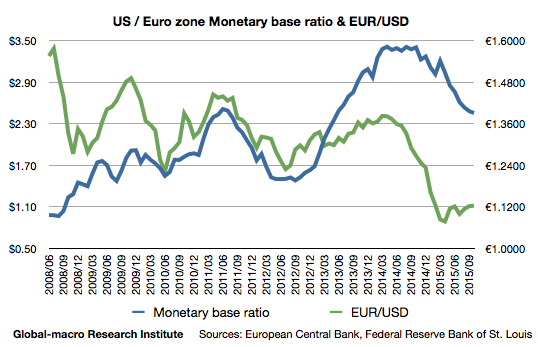
The monetary base ratio is the amount of the dollar issued per one euro. Since the Fed ceased the QE in October 2014, and the ECB started the QE in March 2015, the ratio has been decreasing.
As of October 2015, the monetary base of the euro zone is €1.67 trillion, and the ECB is expected to increase it to €2.69 trillion by March 2017. By then, the monetary base ratio is expected to be about $1.52, which is near the level as of late 2012.
If we only consider the monetary base difference, we might conclude EUR/USD should be around €1.25 as was the case in 2012, but we also observe in the chart the downward trend of the exchange rate and the upward trend in the monetary base ratio.
The reason for the relative downtrend of EUR/USD to the monetary base ratio is the differences in the economic growths and interest rates. EUR/USD is a currency pair that is highly affected by the difference in interest rates, which would not change for a while as long as the Fed remains eager to raise rates.
Therefore, the trends we observed above would not change for the next few years, and thus we may simply apply the existing trend to forecast the future of EUR/USD.
Where should EUR/USD be?
So, where is the appropriate range for EUR/USD? In the chart, the long-term trend is that the exchange rate decreases by €0.12 when the monetary base ratio increases by $0.6. Considering this, the levels in September 2015, the exchange rate at around €1.12 and the monetary base ratio at around $2.30 is appropriate. Given that the ratio is going to be below $1.70 by March 2017, the exchange rate should be also below €1, the parity.
This is the forecast of EUR/USD until March 2017, and the euro would be more depreciated when the ECB extends or expands the QE further. However, the uptrend of the dollar is also likely to be ending by then, as the strong dollar could hurt the economic growth of the US.
Consequently, we observe a little room for EUR/USD to go down further, and even in case of further extension of the QE, it is also likely that the uptrend of the dollar would end before 2017. This is the reason why the writer is not selling the euro.
If you insist to sell the euro, however, you have an option to buy gold and sell the euro, instead of buying the dollar. In 2016, the timing to buy gold is very important and will decide the performance of an investor significantly.
The reverse of the uptrend of the dollar will reverse everything in the financial markets. The moment will come for the US to be unable to tolerate the strong dollar, just as in the Plaza Accord. Investors must remember that Black Monday was caused by the central banks failing to be in unison. The same thing will occur.